
Fabric Plan is the planning part of Microsoft Fabric IQ: budgets, forecasts and what-if scenarios, built on the same data as your reports. It has three kinds of sheet. Planning sheets hold the plans, intelligence sheets report on them, and PowerTable sheets manage the data around them: reference lists, mappings and records people type in. Plan is mainly a budgeting and forecasting tool, but in this post I am using it more for data entry as part of a fab-u-lous Fabric Strictly mashup. I don’t think this is what Lumel really had in mind for their product.
Series 24 of Strictly Come Dancing went live on Saturday 26 September, and this year I’m typing the judges’ scores into Fabric Plan as they’re given. From there they flow into my Lakehouse, my Power BI report and my Fabric IQ ontology; more on that in my next post.
For series 1 to 23, the scores came from Wikipedia and the Strictly fandom wiki, collected after the event. For the live series, I wanted to own the data entry: a sheet I fill in on the sofa, with rules that stop a typo before it reaches a report.
Fabric Plan’s PowerTable sheets do that. They look like a spreadsheet, but every row is written straight to a database table. This post covers how I set it up, the two things that caught me out, and what happens on a Saturday night.
How the pieces fit#
The database comes first. PowerTable doesn’t hold data itself: it reads from and writes to a Fabric SQL database. So the order is database, then Plan item, then sheets.
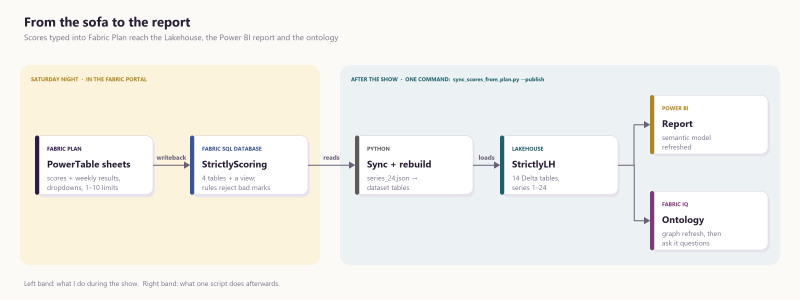
Everything left of the sync script happens in the Fabric portal. Everything right of it is one command I run after the show.
Step 1: Create the database and its rules#
I created a Fabric SQL database called StrictlyScoring in my Fabric workspace, with five tables. Two I fill in; three act as lookup lists that feed the dropdowns.
| Table | Filled by | One row per |
|---|---|---|
s24_routine | me, in Plan | dance: week, running order, couple, dance, routine type, song, and one column per judge |
s24_week_result | me, in Plan | week: show date, theme, the dance-off couples, who left |
s24_couple | pre-filled | couple (all 15), e.g. “Dani Dyer & Nikita Kuzmin” |
s24_dance | pre-filled | dance: 24 dances, each with its family (ballroom, Latin or other) |
s24_routine_type | pre-filled | routine type: the ten kinds, from main dance to showdance |
The judges get a column each: craig, motsi, shirley and anton, plus an optional guest judge and mark.
The tables form a small star schema. s24_routine is the fact table in the middle, with one row per dance and the judges’ marks as its measures. The other four tables are its dimensions: who danced, what they danced, what kind of routine it was, and which week.
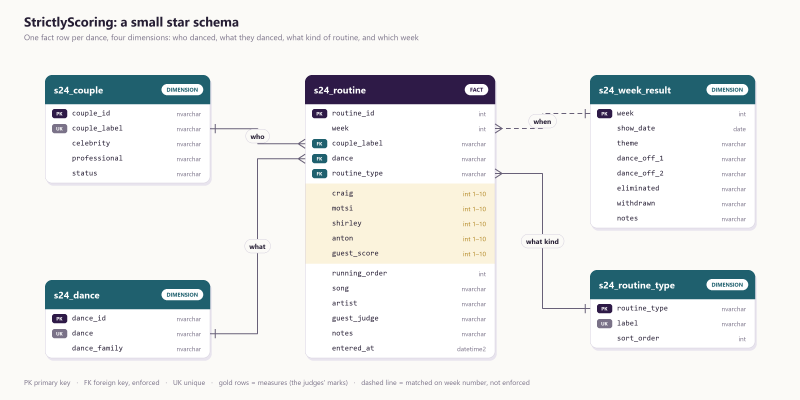
The solid lines are foreign keys the database enforces. The dotted line only matches on week number, so I can enter Saturday’s routines before Sunday’s result row exists. The results table’s four couple columns also point at s24_couple; I’ve left those lines off to keep the star readable.
Totals aren’t stored in the table. A view, v_s24_routine_scored, adds up each routine’s marks and average. That keeps the sheet to the numbers I actually type.
Step 2: Create the Plan item and the scores sheet#
Next, in the Fabric workspace:
- Select New item → Plan and give it a name. Mine is
StrictlyScoringPlan. - Select New Sheet → PowerTable, then Create a New App.
- Pick the connection to the
StrictlyScoringdatabase. If there isn’t one, Create Connection makes it. - Choose Existing Table, schema
dbo, tables24_routine, and select Next.
PowerTable then shows a Configure Table screen. It reads each column’s data type from the database and suggests an input type: Number, Text, Date Time and so on.

Check that routine_id is the primary key and marked as an identity column. The database numbers each routine itself, so it’s never typed. Then select Finish and Save.
The sheet opens as an empty grid, one column per database column.
Step 3: Turn columns into dropdowns and add a live total#
The Configure Table screen only sets data types. Dropdowns and limits are set on the sheet afterwards: hover over a column heading, select …, then Edit.

| Column | Input type | Setting |
|---|---|---|
couple_label | Single Select | Lookup on dbo.s24_couple, key and display column couple_label |
dance | Single Select | Lookup on dbo.s24_dance, key and display column dance |
routine_type | Single Select | Lookup on dbo.s24_routine_type, key routine_type, display label |
craig, motsi, shirley, anton, guest_score | Number | Minimum 1, maximum 10 |
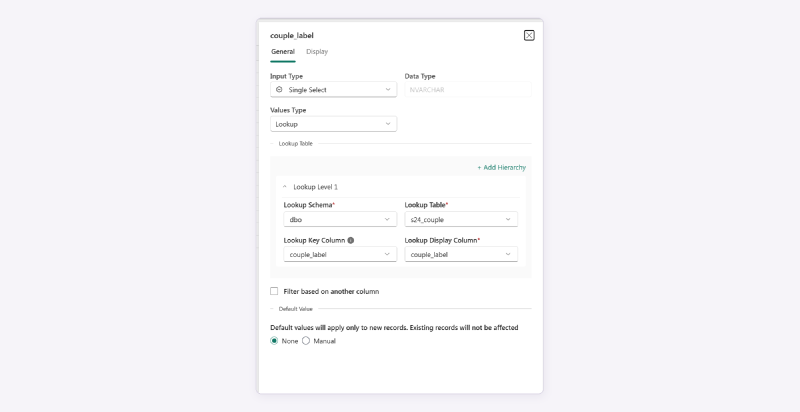
A Lookup fills the dropdown from another table (Microsoft’s lookup guide). The sheet then shows a couple’s name and stores exactly the text the database expects, so a misspelt name can’t get in.
The useful part is the rules. They’re built into s24_routine, the table behind the Plan sheet, so a bad entry is refused whether it’s typed into Plan or arrives any other way:
- a mark must be a whole number from 1 to 10;
- the couple and the dance must come from the two lists;
- the routine type must be one I already use (main, second dance, Couple’s Choice, showdance and so on);
- the same couple can’t dance the same dance twice in one week, unless it’s marked as a second dance.
I tested it by trying to enter a mark of 11. The database rejected it, which is exactly what I want when entering the scores from the sofa on a Saturday evening.
Setting the 1–10 limit on the sheet as well means the mistake is flagged in the cell, before I try to save.
Last, I added a Formula column called Total: craig + motsi + shirley + anton. It only exists in the sheet, so it’s never written back. It shows the total as I type the fourth mark.
Step 4: Add a results sheet#
Each PowerTable sheet is tied to one table, so the week’s result gets its own sheet in the same Plan item. The two kinds of row are different: a week has about 15 dances, but only one dance-off and one exit.
If the result lived in the scores table, I’d either type the eliminated couple into all 15 rows or pick one row to carry it. A separate s24_week_result table keeps it to one row per Sunday.
The setup is the same as Step 2, choosing s24_week_result. This time week is the primary key but not an identity column, because I type the week number. The four couple columns (dance_off_1, dance_off_2, eliminated, withdrawn) get the same couple lookup as the scores sheet.

The results sheet is optional. Without it, the scores still flow through; couples just stay “Competing” in the report until results arrive.
Two things that caught me out#
PowerTable doesn’t support TINYINT. In my first version of the routines table, which holds the scores, I’d made the judge columns TINYINT, since a mark never goes above 10. On the Configure Table screen those four columns were outlined in red and Finish stayed greyed out, with no message saying why.
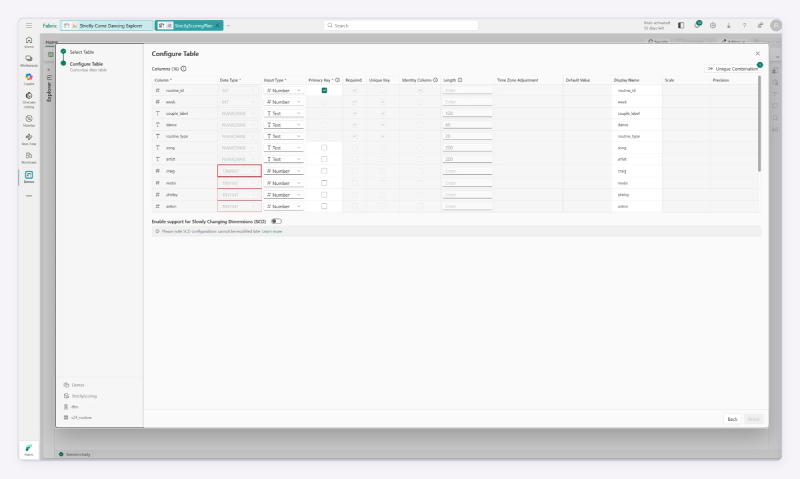
The fix was to change them to INT in the database, keeping the 1–10 rule. Then I selected Back and chose the table again, because the wizard keeps the column types it read first. If you’re designing tables for PowerTable, stick to INT for whole numbers.
Lookup columns are renamed. When I turned the four couple columns on the results sheet into lookups, all four headings changed to couple_label, the name of the lookup table’s display column. Nothing changed in the database, but I couldn’t tell which column was which.
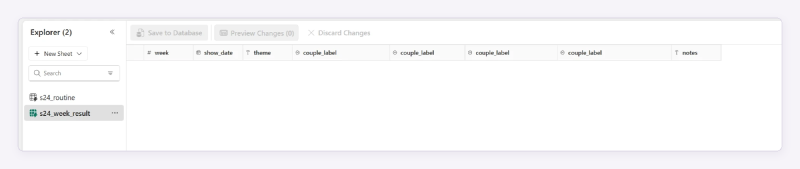
The columns stay in their original order, so they could be identified. The fix was the Display Name setting, which is easy to miss. In a column’s Edit panel it’s on the second tab, Display, not on General with everything else. (It’s also near the far right of the Configure Table grid, past Length, Time Zone Adjustment and Default Value.) I set it to Dance-off 1, Dance-off 2, Eliminated and Withdrawn. It changes only the label, and the lookup keeps working.

Saturday night#
- Before the show: add a row for each routine as it’s announced, with week, running order, couple, dance and song.
- During the show: type the four marks as the judges hold up their paddles.
Totalfills in as I go, and Save to Database writes the rows back. - After Sunday’s results: add the week’s row on the results sheet.
- Then: load them into the Lakehouse (more on that in my next post).
On the night I used a PowerTable form on my tablet instead of the grid. It’s one routine per submission, with the same dropdowns and 1–10 limits as the sheet.
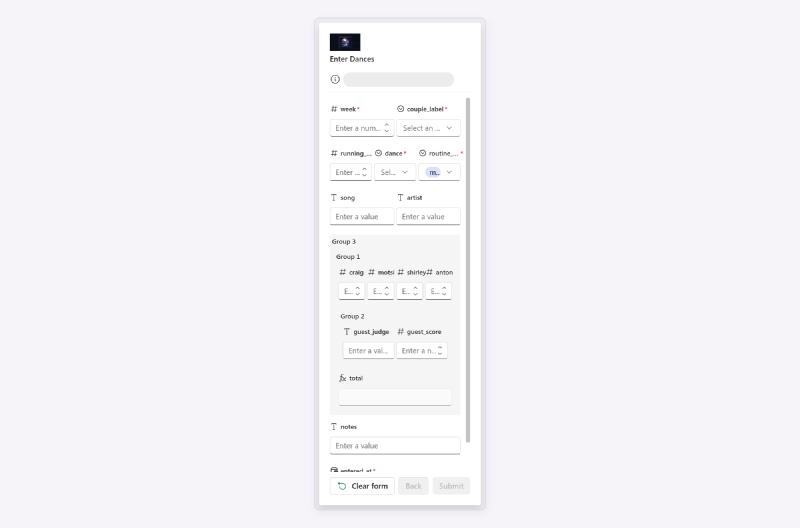
Making the form is quick (Microsoft’s guide). On the sheet, select Setup → Forms → Create a Form, and PowerTable builds one from every column in the table. I grouped the four judges’ marks together. Then Share → Generate Link gives a link, which can be open to everyone or limited to named people, with an expiry date.
That link is my one disappointment. As far as I could find, the only way to open the form is via its URL: there’s no button in the Plan item, the workspace or anywhere else in Fabric. A form this useful deserves a proper way in, such as a button in a Power BI report, a link in an org app, or a tile on the Plan item itself.
After the show, a script loads the night’s scores into my Lakehouse alongside series 1 to 23, ready for the Power BI report and the ontology. So a question like “How does Craig mark this year’s Cha-cha-chas against the last ten years?” can be answered the morning after the show. How that works is the subject of my next post.
Why this pattern is worth borrowing#
The real idea isn’t to embed Strictly into your data platform, but to show how to give people a simple sheet on top of a database table, with lookups, validation rules and formulas in place.
PowerTable gave me an entry screen that feels like Excel, but with dropdowns from real reference tables. Every value it saves is checked by the database before it’s accepted. The same shape fits sales targets, stock counts, survey scores, or anything a person types in that a report depends on.
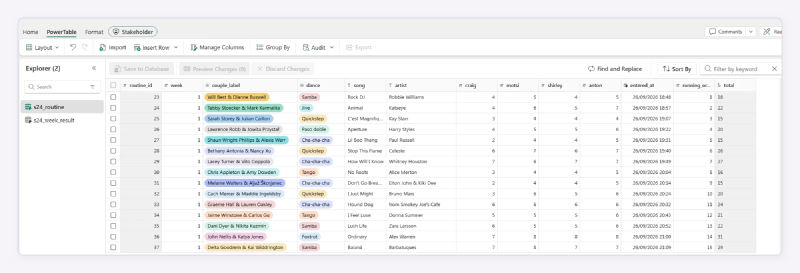
Here’s where the first live show ended up: all 15 week 1 routines in the sheet, in running order, with John & Katya’s Foxtrot top on 31.
And remember, keeeep… coding!